

The Palisades Fire in California serves as a stark reminder of the growing threat of wildfires in an era of climate change and urban sprawl. This devastating event, which scorched thousands of acres and forced evacuations, highlighted the critical role that Geographic Information Systems (GIS) and remote sensing technologies play in disaster management, mitigation, and recovery efforts. In this blog, we will delve into how GIS was utilized during the Palisades Fire, the importance of remote sensing technologies, and the future of geospatial solutions in wildfire management.
Understanding the Palisades Fire
The Palisades Fire began in the rugged terrain of the Santa Monica Mountains, an area known for its chaparral vegetation and steep slopes. The combination of these geographic factors made the region highly susceptible to wildfires, especially during California’s dry season when vegetation becomes highly flammable. Furthermore, strong Santa Ana winds exacerbated the spread of the fire, pushing flames rapidly through canyons and toward residential areas.

The upper image showcases the damage due to Palisades Fire
The fire’s rapid growth necessitated immediate action, and GIS was at the forefront of these efforts. Through geospatial analyses, authorities were able to map out affected areas, predict fire behavior, and deploy resources efficiently. This highlights the indispensable role of GIS in understanding and addressing such complex disasters.
GIS was utilized to create a detailed map of the fire’s impact, including the damage and threat levels of houses, buildings, and other structures. The fire’s extent was also mapped- Palisades Fire Damage Map

Also, the Normalized Burn Ratio (NBR) was a critical geospatial index used to identify and assess fire-affected areas. Derived from near-infrared (NIR) and shortwave-infrared (SWIR) satellite bands, NBR was highly effective in detecting vegetation health and the extent of burned land. Pre-fire and post-fire NBR values were often compared to calculate the difference, known as the dNBR (differenced NBR), which highlighted the severity of the burn.
Using NBR, authorities could monitor vegetation stress levels and identify areas with higher susceptibility to wildfires. Predicting fire behavior with NBR involved analyzing pre-fire conditions, such as vegetation density and dryness, which NBR’s sensitivity to water and vegetation properties made possible. This allowed for the identification of potential fire hotspots and enhanced preparedness for wildfire events.
The fire’s rapid growth had necessitated immediate action, and GIS had been at the forefront of these efforts. Through geospatial analyses, authorities had mapped out affected areas, predicted fire behavior, and deployed resources efficiently. This underscored the indispensable role of GIS in understanding and addressing such complex disasters.

On the image above the areas in red showcase the areas which were more susceptible to fire. Through this high risk zones could been identified
The Role of GIS in Pre-Fire Planning
GIS is a powerful tool for identifying wildfire risks even before they occur. By analyzing historical wildfire patterns, GIS can help authorities identify regions prone to ignition. In the case of the Palisades Fire, pre-existing GIS data on vegetation type, land cover, and topography proved critical in developing fire risk assessments.
GIS experts simulated potential fire spread based on weather forecasts, fuel moisture levels, and wind patterns. This information allowed decision-makers to undertake precautionary measures, such as clearing brush, conducting prescribed burns, and establishing firebreaks in strategic locations.
In urban-wildland interface areas, GIS also played a key role in zoning regulations and planning. Maps highlighting fire-prone zones helped urban planners and homeowners adopt fire-resistant landscaping practices and building materials to mitigate damage.
Apart from this GIS also played an important role in deriving the reasons for Palisades Fire.

Through GIS it was evident that wind direction played a pivotal role in the rapid escalation of the Palisades Fire, as strong gusts and shifting wind patterns caused the flames to spread unpredictably across a wide area. Gentle yet persistent winds around Los Angeles acted as a catalyst, carrying embers over long distances and igniting new hotspots. This phenomenon, often observed in urban-wildland interface areas, significantly complicated containment efforts and heightened the fire’s impact.
GIS proved indispensable in analyzing and visualizing wind dynamics, offering real-time insights into how wind patterns influenced fire behavior. By integrating meteorological data, such as wind speed and direction, into GIS platforms, experts were able to map out areas at heightened risk of fire spread.

The video of wind patterns around Los Angeles further illustrated how gentle yet steady winds contributed to the fire’s growth, providing critical visual evidence for decision-makers.
GIS also helped overlay wind data with other spatial datasets, such as vegetation type and urban infrastructure, enabling authorities to assess vulnerable areas and optimize fire suppression strategies.
This comprehensive approach highlighted the importance of incorporating wind analysis into fire risk management, showcasing how GIS not only supports proactive measures like firebreak creation but also helps predict and mitigate the scale of such disasters.
Real-Time Fire Monitoring with Remote Sensing

As the Palisades Fire erupted, real-time data became the cornerstone of firefighting efforts. Remote sensing platforms, such as NASA’s Moderate Resolution Imaging Spectroradiometer (MODIS) and Visible Infrared Imaging Radiometer Suite (VIIRS), provided critical thermal anomaly data. These tools detected heat signatures from active fire fronts, enabling rapid identification of the fire’s location and intensity.

Integrating this data into GIS platforms allowed emergency responders to visualize the fire’s progression in near real-time. Dynamic fire maps displayed active fire perimeters, hotspots, and areas requiring immediate attention. Such visualization proved invaluable for coordinating firefighting crews, helicopters, and air tankers.
Areas of high vulnerability, along with buildings, houses, and other structures, were easily identified.

Unmanned Aerial Vehicles (UAVs), equipped with infrared cameras, complemented satellite imagery by providing high-resolution thermal data. UAVs flew over rugged terrain inaccessible to ground crews, capturing detailed information about fire hotspots and smoldering areas. These images were processed and integrated into GIS platforms, ensuring that fire managers had the most up-to-date information at their disposal.

Evacuation Planning and Public Safety
When wildfires threaten densely populated areas, rapid and effective evacuation planning becomes paramount. GIS provided the tools necessary to design evacuation routes tailored to the unique challenges of the Palisades Fire. By overlaying fire progression data with road networks, population density maps, and critical infrastructure locations, authorities were able to create optimized evacuation strategies.
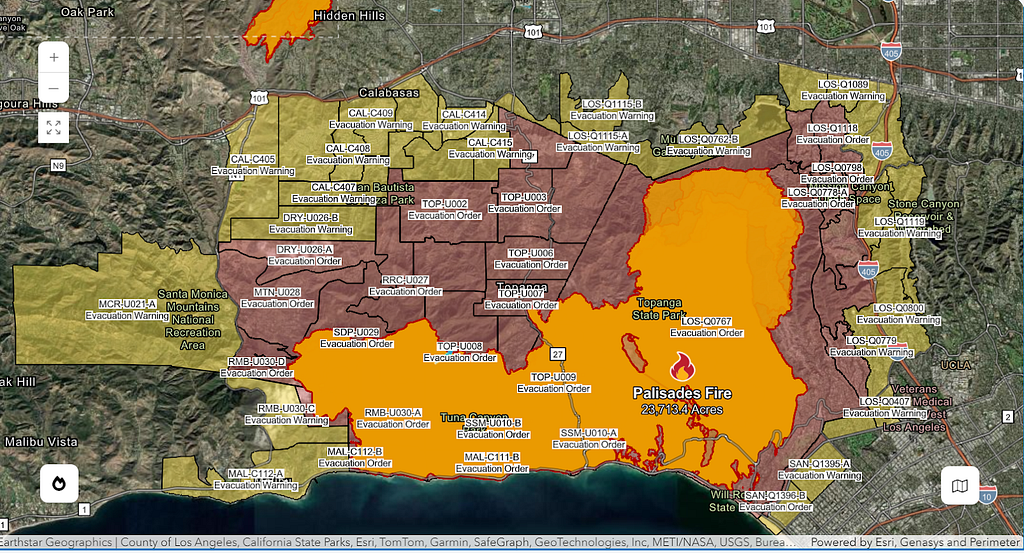
Interactive GIS dashboards, built using tools like Esri’s ArcGIS Online, allowed both responders and residents to access real-time fire maps. These dashboards highlighted evacuation zones, shelter locations, and road closures, helping residents make informed decisions during the crisis. The integration of live traffic data ensured that evacuation routes remained clear and efficient, minimizing congestion and panic.

Damage Assessment and Post-Fire Recovery
After the flames subsided, the work of recovery began. GIS proved essential in assessing the damage caused by the Palisades Fire. High-resolution imagery from Planet Labs and DigitalGlobe captured detailed views of the burn area, enabling authorities to create burn severity maps. These maps were used to prioritize recovery efforts, such as soil stabilization, reforestation, and rebuilding critical infrastructure.
One of the key post-fire challenges was the risk of secondary disasters, such as landslides and flash floods. The intense heat from wildfires often creates hydrophobic soils, which repel water and increase runoff during rains. Using Sentinel-1 Synthetic Aperture Radar (SAR) data, GIS models identified areas most at risk of erosion and flooding. This information guided the deployment of erosion control measures, such as installing sediment barriers and reseeding vegetation.
The Future of GIS in Wildfire Management
The lessons learned from the Palisades Fire underscore the need for continued innovation in geospatial technologies. The future of GIS in wildfire management will likely focus on real-time data integration, enhanced collaboration, and greater accessibility for the public. Cloud-based GIS platforms will enable seamless sharing of data among agencies, while 5G connectivity will facilitate faster updates from IoT devices and drones.
Emerging technologies, such as LiDAR and hyperspectral imaging, will further enhance the accuracy of wildfire modeling. Ground-based IoT sensors, capable of monitoring temperature, humidity, and wind speeds, will provide granular data for predictive models. These advances will create a comprehensive, multi-scale approach to wildfire management, combining satellite, aerial, and ground-level data.


Conclusion
The Palisades Fire served as a poignant example of how GIS (Geographic Information Systems) and remote sensing technologies played a crucial role in managing wildfires, from pre-fire planning to real-time monitoring and post-fire recovery. The integration of these tools allowed for more effective strategies to mitigate the impacts of wildfires, ultimately saving lives and minimizing property damage. GIS, with its ability to analyze spatial data and visualize fire-prone areas, supported decision-makers in identifying high-risk zones, aiding in evacuation planning, and ensuring that firefighting resources were deployed efficiently.
GIS showed that pre-fire planning was an essential step in wildfire management, and it played a central role by enabling the creation of risk maps based on factors such as vegetation type, weather conditions, and topography. By using remote sensing data from satellites, such as the MODIS and Landsat programs, authorities tracked fire behavior, identified vulnerable areas, and planned firebreaks in advance. These insights allowed for more targeted interventions and better preparedness when wildfires occurred, helping communities anticipate threats before they escalated.
During the fire itself, GIS became a real-time tool that helped authorities track fire progression, monitor wind patterns, and assess the impact on infrastructure and communities. Remote sensing technologies, such as drones and satellites, provided continuous, up-to-date imagery that enhanced situational awareness. This data allowed for more informed decisions regarding evacuation routes, resource allocation, and firefighting strategies, ensuring a quicker and more effective response to the emergency.
After the fire, GIS remained invaluable in assessing the extent of the damage, identifying areas that needed immediate attention, and planning for long-term recovery. By analyzing post-fire imagery, authorities mapped burned areas, assessed soil erosion risks, and planned restoration efforts, such as reforestation or the rehabilitation of infrastructure. GIS also helped in monitoring environmental changes over time, ensuring that recovery efforts were on track and that future risks were minimized.
As climate change continued to exacerbate the frequency and intensity of wildfires, the importance of GIS and remote sensing technologies in wildfire management grew. The ability to analyze and interpret spatial data became critical in adapting to the new challenges posed by changing environmental conditions. The Palisades Fire underscored how these technologies were transforming the way we approached wildfire management, making it possible to respond more effectively and recover more swiftly from such devastating events.
Investing in GIS and fostering innovation in this field provided communities with the tools they needed to better understand fire behavior, make informed decisions, and build resilience against future fires. By improving the integration of geospatial technologies into wildfire management strategies, a more proactive and adaptive approach to fire prevention, suppression, and recovery was created. The Palisades Fire served as a powerful reminder of the potential of GIS in combating one of nature’s most formidable forces, offering a path toward a safer and more resilient future.